| Поиск по каталогу |
|
(строгое соответствие)
|
- Профессиональная
- Научно-популярная
- Художественная
- Публицистика
- Детская
- Искусство
- Хобби, семья, дом
- Спорт
- Путеводители
- Блокноты, тетради, открытки
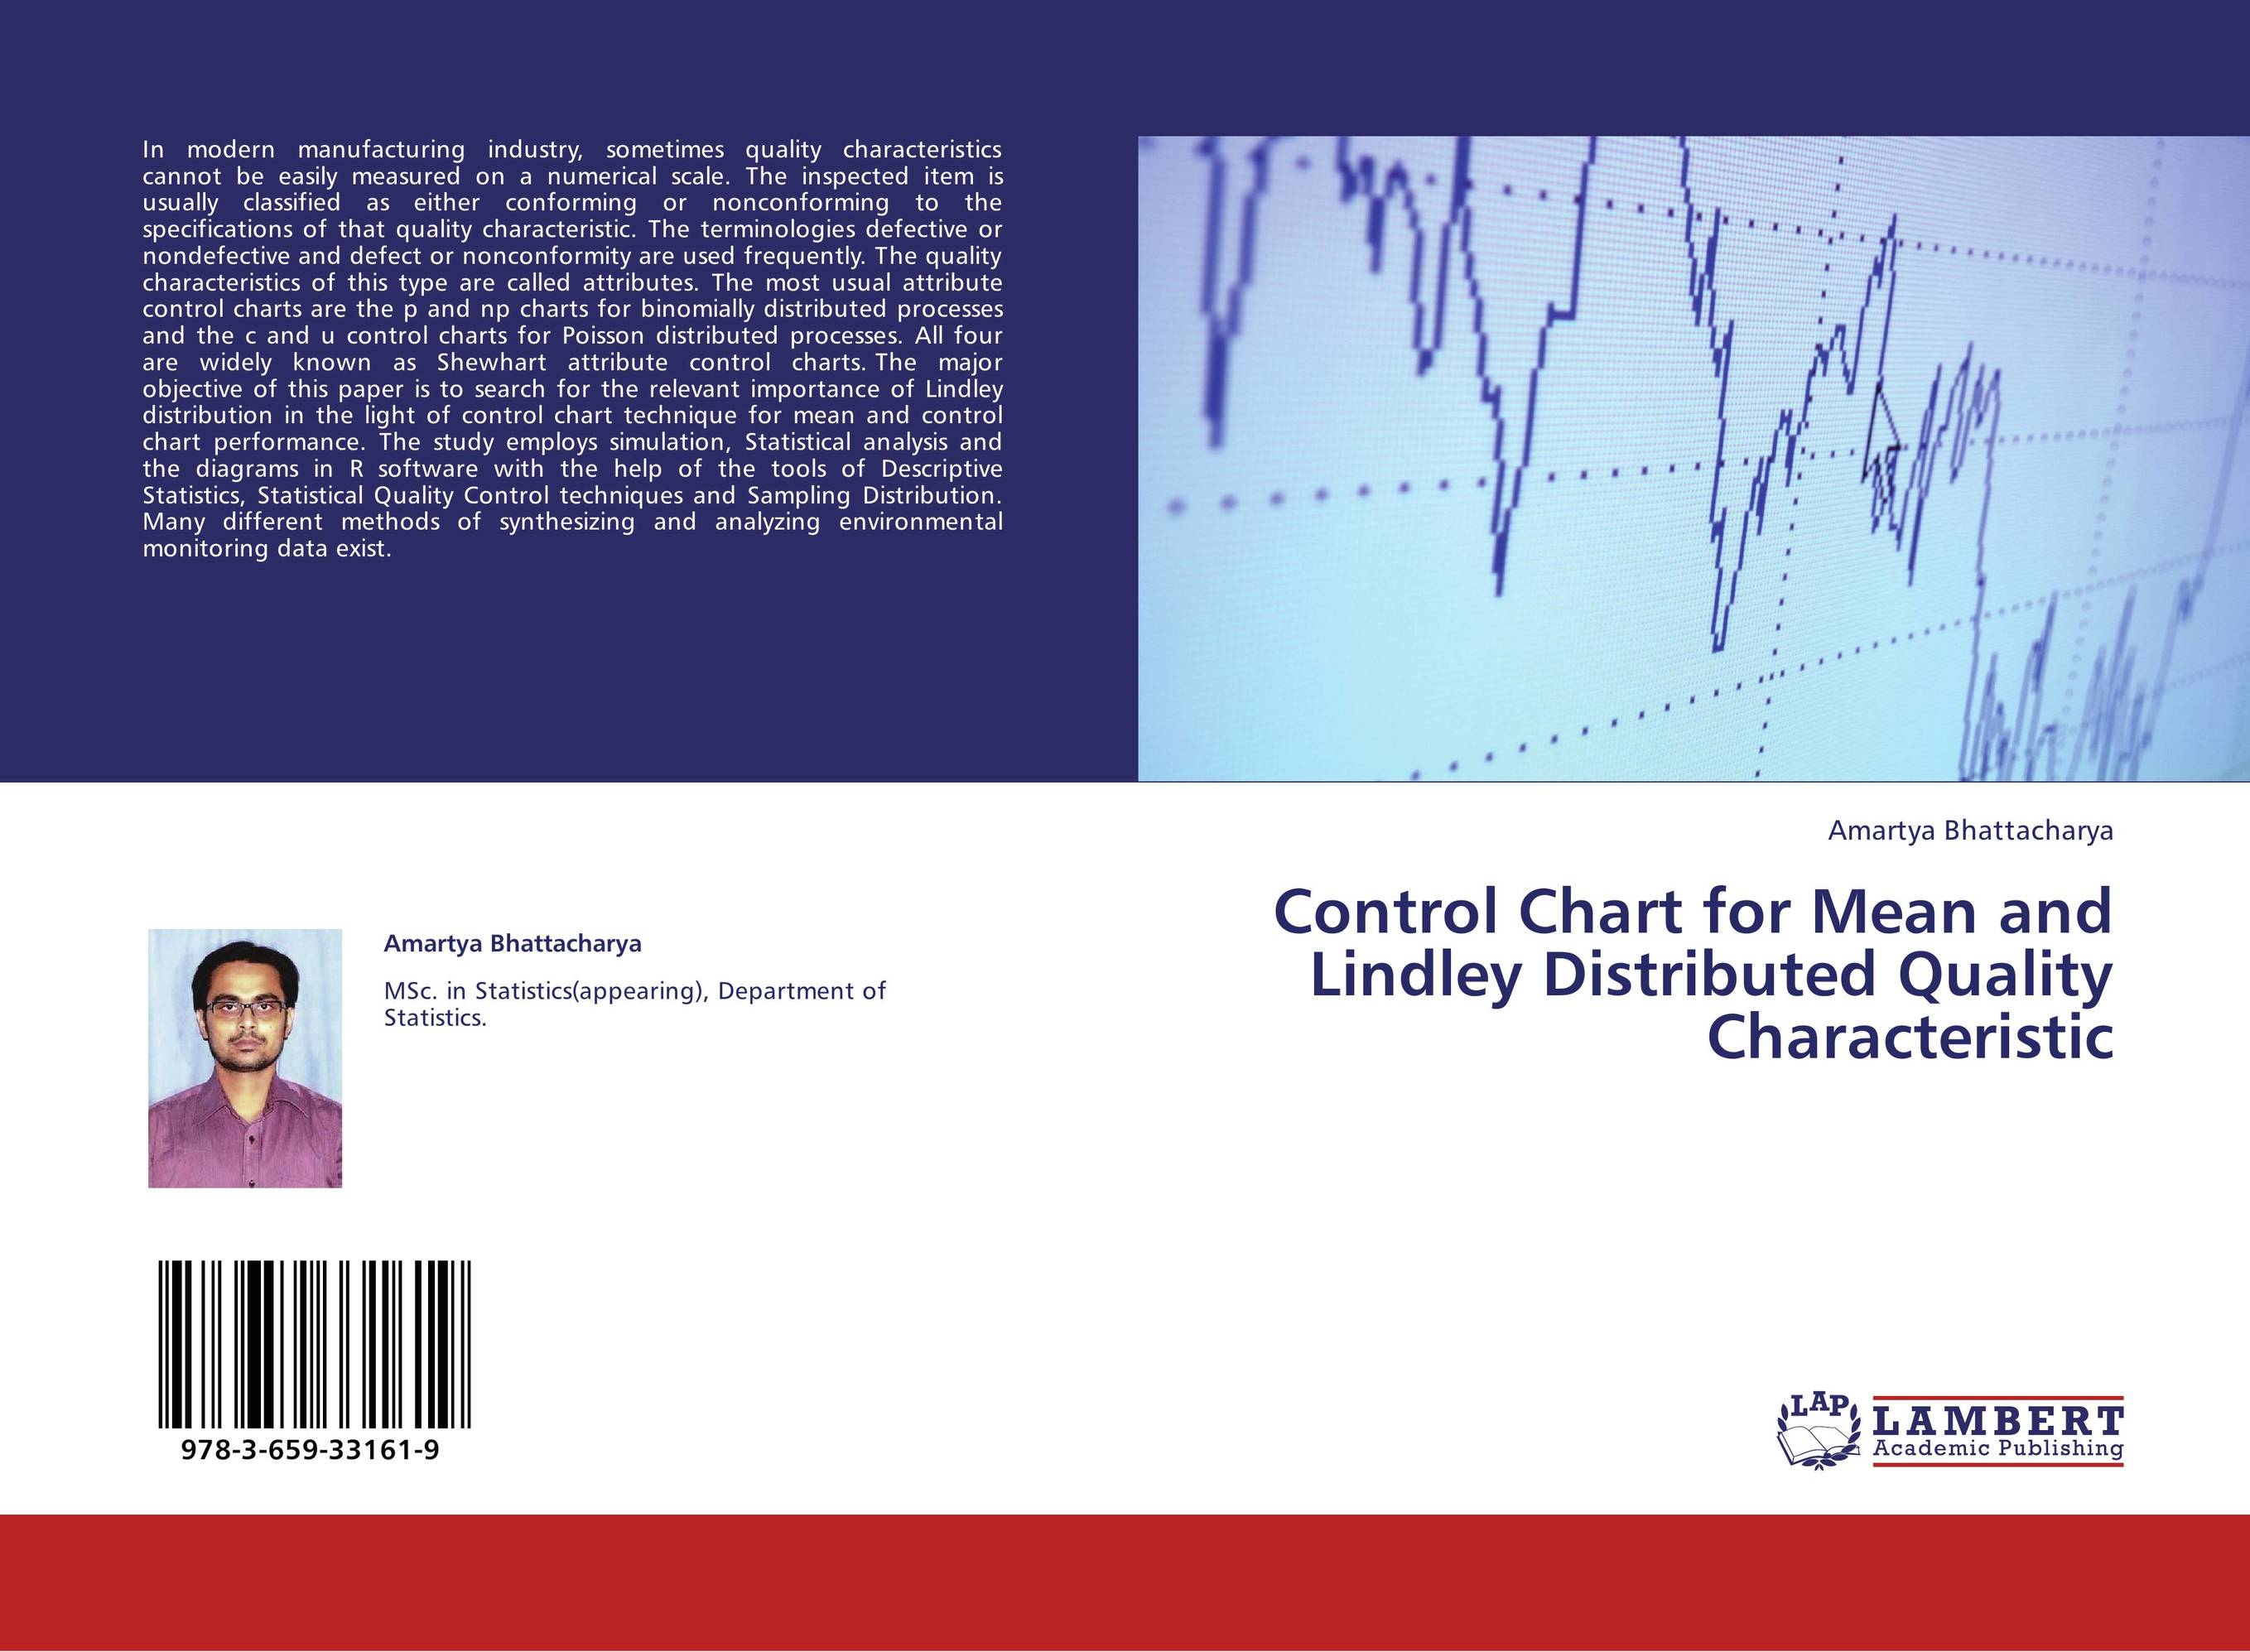
Control Chart for Mean and Lindley Distributed Quality Characteristic.

В наличии
| Местонахождение: Алматы | Состояние экземпляра: новый |

Бумажная
версия
версия
Автор: Amartya Bhattacharya
ISBN: 9783659331619
Год издания: 2013
Формат книги: 60×90/16 (145×215 мм)
Количество страниц: 56
Издательство: LAP LAMBERT Academic Publishing
Цена: 29648 тг
Положить в корзину
| Способы доставки в город Алматы * комплектация (срок до отгрузки) не более 2 рабочих дней |
| Самовывоз из города Алматы (пункты самовывоза партнёра CDEK) |
| Курьерская доставка CDEK из города Москва |
| Доставка Почтой России из города Москва |
Аннотация: In modern manufacturing industry, sometimes quality characteristics cannot be easily measured on a numerical scale. The inspected item is usually classified as either conforming or nonconforming to the specifications of that quality characteristic. The terminologies defective or nondefective and defect or nonconformity are used frequently. The quality characteristics of this type are called attributes. The most usual attribute control charts are the p and np charts for binomially distributed processes and the c and u control charts for Poisson distributed processes. All four are widely known as Shewhart attribute control charts. The major objective of this paper is to search for the relevant importance of Lindley distribution in the light of control chart technique for mean and control chart performance. The study employs simulation, Statistical analysis and the diagrams in R software with the help of the tools of Descriptive Statistics, Statistical Quality Control techniques and Sampling Distribution. Many different methods of synthesizing and analyzing environmental monitoring data exist.
Ключевые слова: Control Chart, statistical quality control


