| Поиск по каталогу |
|
(строгое соответствие)
|
- Профессиональная
- Научно-популярная
- Художественная
- Публицистика
- Детская
- Искусство
- Хобби, семья, дом
- Спорт
- Путеводители
- Блокноты, тетради, открытки
Nonlinear Correlation between Prime Indian and American Stock Market.

В наличии
| Местонахождение: Алматы | Состояние экземпляра: новый |

Бумажная
версия
версия
Автор: Swetadri Samadder
ISBN: 9783330043596
Год издания: 2019
Формат книги: 60×90/16 (145×215 мм)
Количество страниц: 56
Издательство: LAP LAMBERT Academic Publishing
Цена: 23066 тг
Положить в корзину
| Способы доставки в город Алматы * комплектация (срок до отгрузки) не более 2 рабочих дней |
| Самовывоз из города Алматы (пункты самовывоза партнёра CDEK) |
| Курьерская доставка CDEK из города Москва |
| Доставка Почтой России из города Москва |
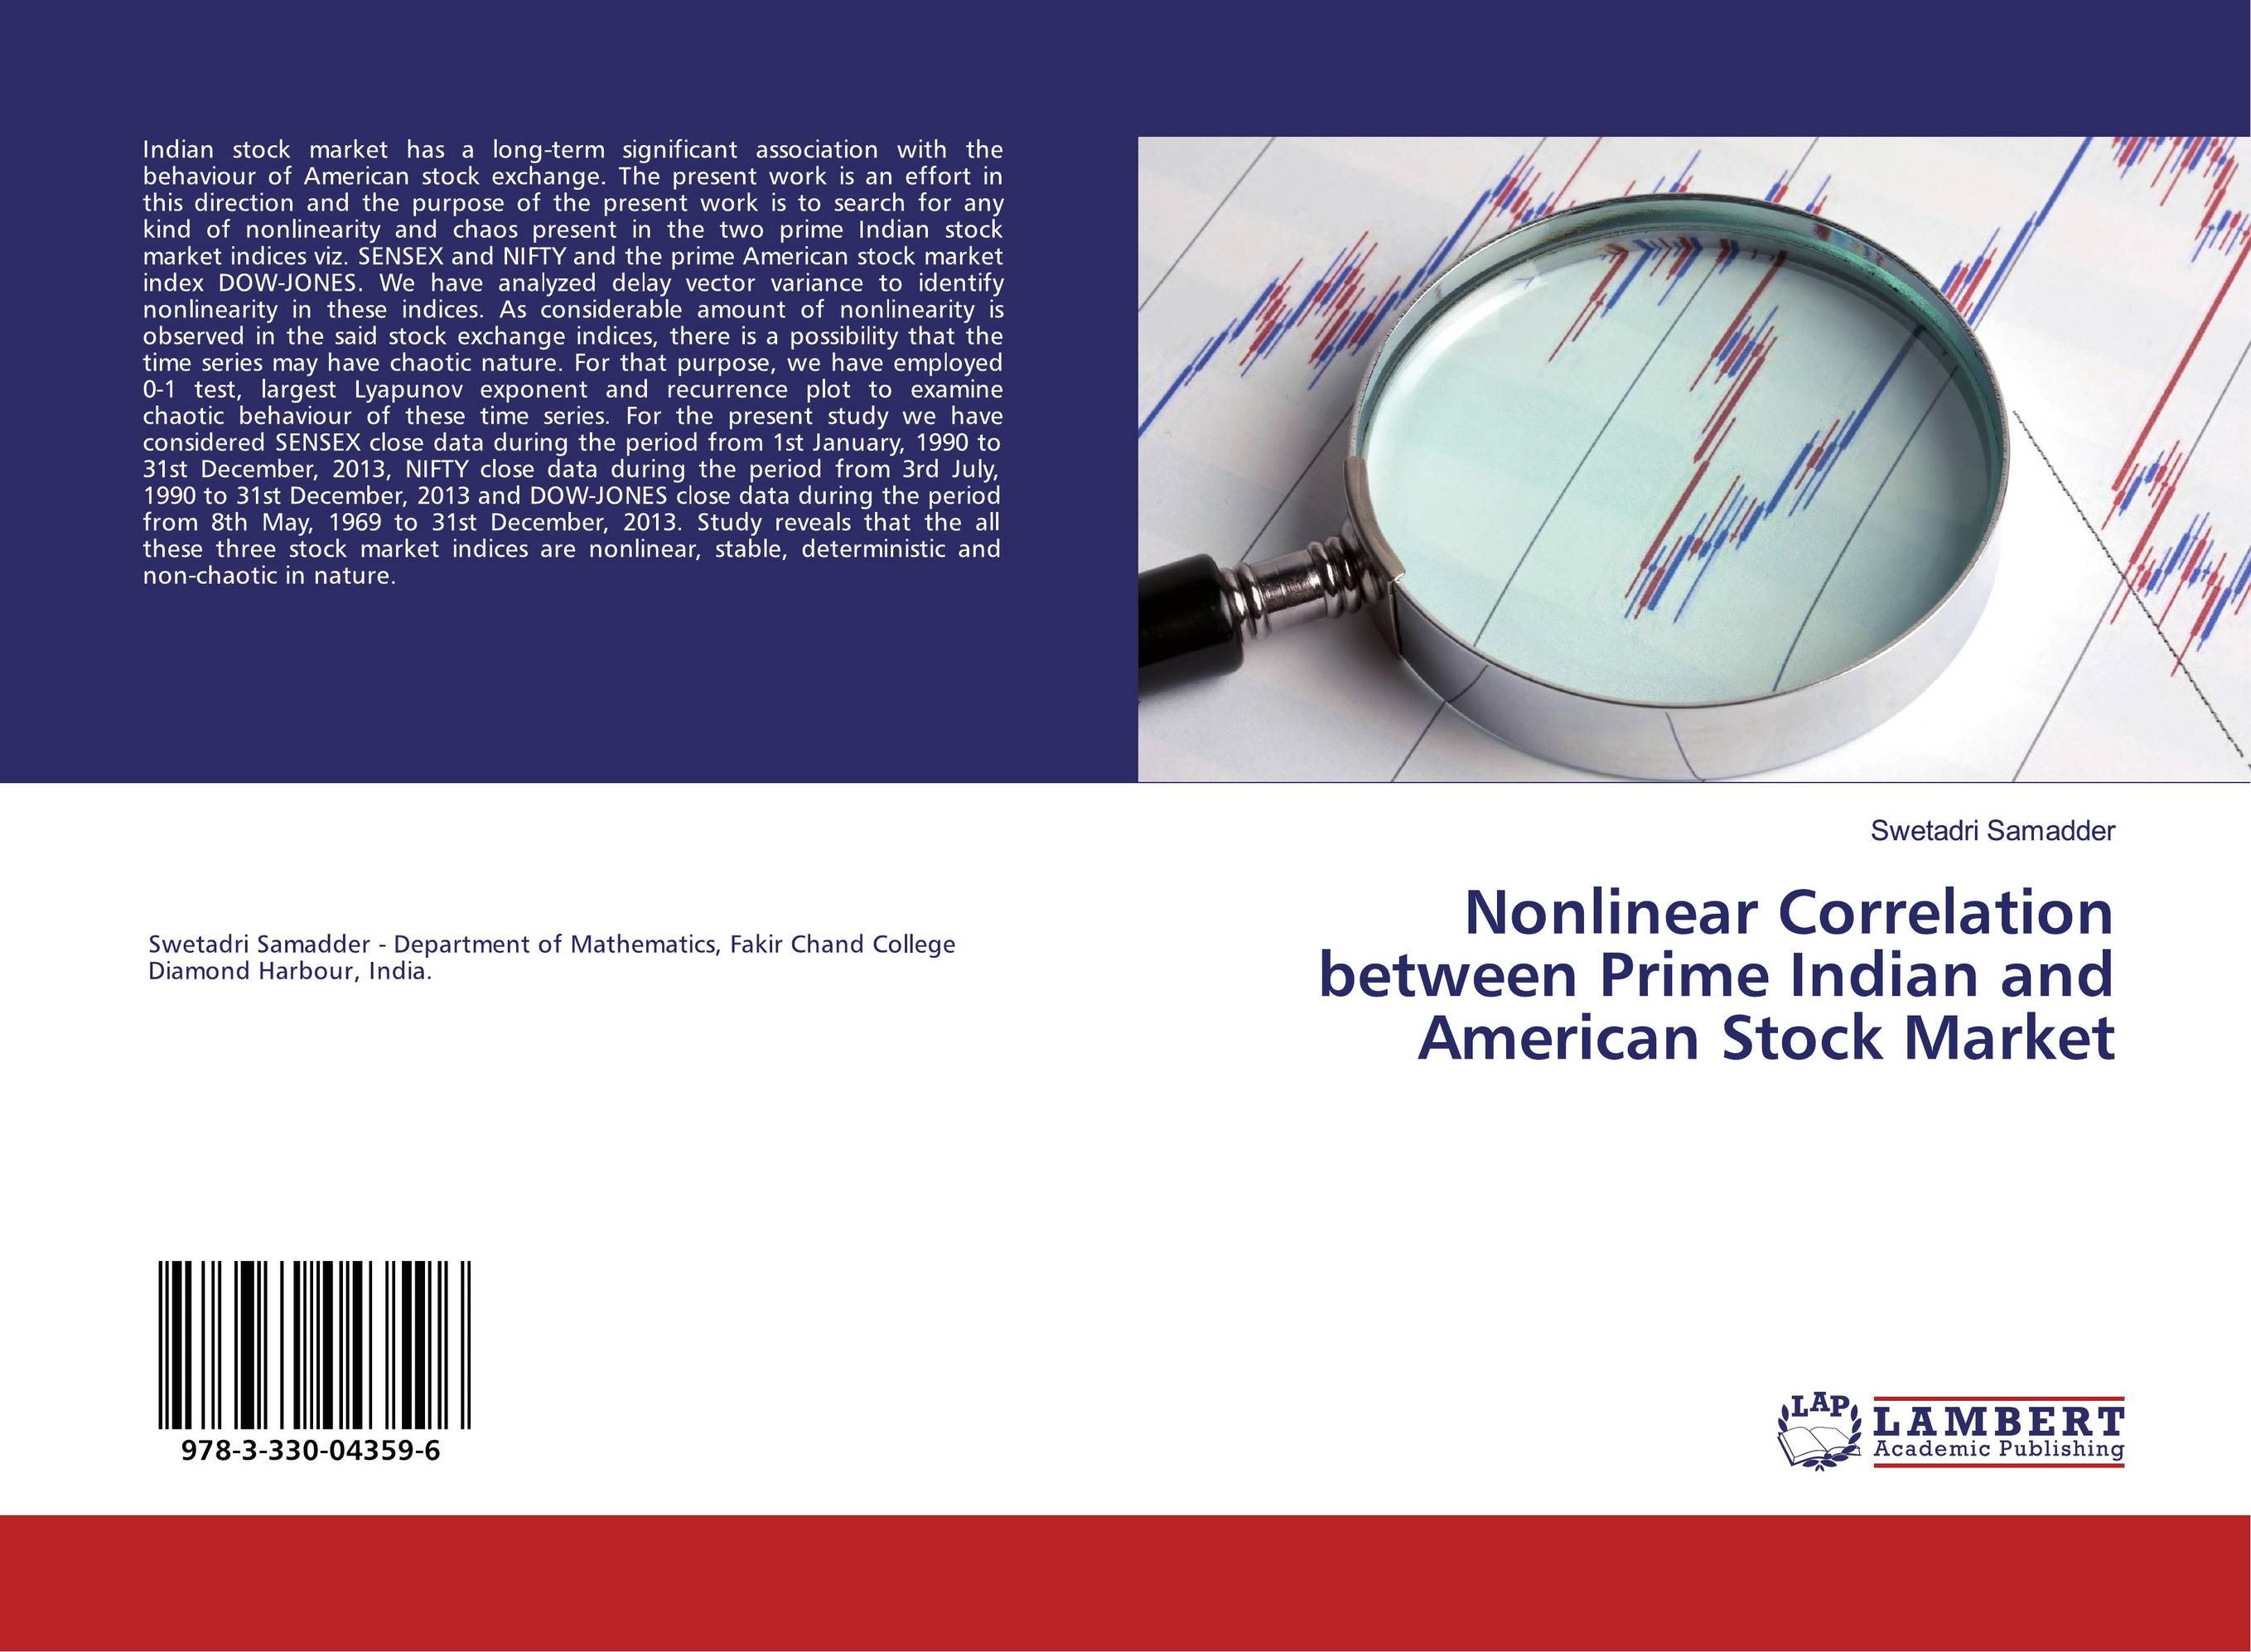
Аннотация: Indian stock market has a long-term significant association with the behaviour of American stock exchange. The present work is an effort in this direction and the purpose of the present work is to search for any kind of nonlinearity and chaos present in the two prime Indian stock market indices viz. SENSEX and NIFTY and the prime American stock market index DOW-JONES. We have analyzed delay vector variance to identify nonlinearity in these indices. As considerable amount of nonlinearity is observed in the said stock exchange indices, there is a possibility that the time series may have chaotic nature. For that purpose, we have employed 0-1 test, largest Lyapunov exponent and recurrence plot to examine chaotic behaviour of these time series. For the present study we have considered SENSEX close data during the period from 1st January, 1990 to 31st December, 2013, NIFTY close data during the period from 3rd July, 1990 to 31st December, 2013 and DOW-JONES close data during the period from 8th May, 1969 to 31st December, 2013. Study reveals that the all these three stock market indices are nonlinear, stable, deterministic and non-chaotic in nature.
Ключевые слова: Sensex, Nifty, DOW-JONES, DVV analysis, 0-1 chaos test, largest Lyapunov exponent, RQA


